Inferring Human Behaviour from IP Activity Data
As part of our research, we have combined large amounts of historical Internet activity data with other datasets that contain information about human, economic behaviour.
These individual cases build a proof-of concept and demonstrate that the Internet activity data collected by KASPR Datahaus can infer human behaviour both at the very granular micro level (sleep and commuting patterns) and the more macro level (economic and sectoral growth).
1. Monitoring How Humanity Goes Online
Previous related studies have used a variety of internet penetration proxies at either snapshot- or annualised- detail, each proxy having one or more compromises such as data-quality problems (in the case of ITU surveys), or actual internet use identification complications (in the case of block-based or router-based assignment). In contrast, since we observe actual end-user IP connections, in well-defined urban boundaries (cities), at 15min intervals, identified by a hitherto unused highly accurate geolocation database, we are able to provide the first accurate estimate of the evolution of the internet’s expansion at monthly intervals.
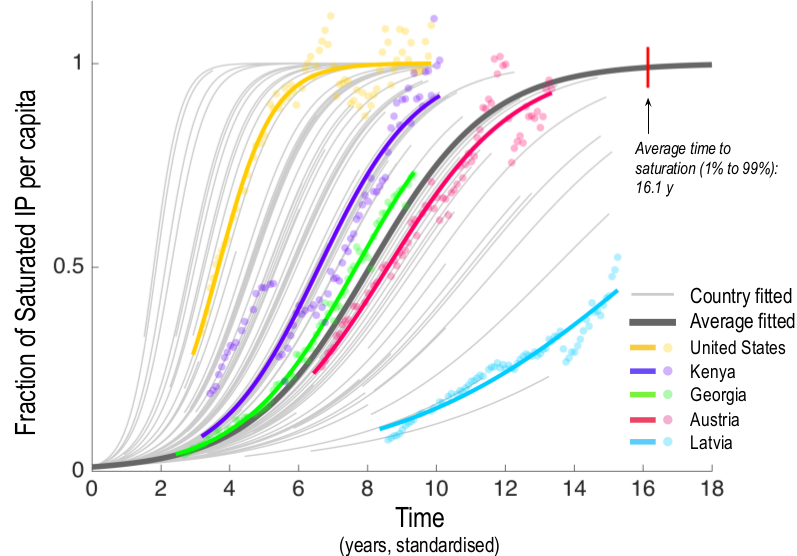
Significantly, given the temporal granularity and global scope of our series, we are able to confirm that the diffusion of the internet does indeed follow an S-, or logistic-, shaped process (Fig. 1). We find that the internet’s general diffusion process has an asymptotic limit of 0.32 IPs per person, equating to an internet `saturation’ level of approximately one IP address for a three person household, on average. Further we estimate that the diffusion process’ average time to saturation within a country is just 16.1 years (1%-99%), eclipsing the estimated 100- and 60- year saturation times for the comparable GPTs of steam-power and electrification respectively.
Our method also enables the elaboration of individual country experiences of the internet’s penetration. Our estimates reveal that whilst several nations already experience saturated internet penetration, others will not reach this point for decades. This method can support decision makers in the public and private ICT sector to systematically monitor the diffusion of ICT at very fine spatial and temporal scale, identify barriers to diffusion and design more precisely targeted strategies to enhance the spread of ICTs.
Figure 1. The diffusion of the internet across 100 nations..
2. Granular Internet Activity Data Correlates with Daily, Sleep-Wake Cycles
In our first application, we have applied a novel machine-learning (ML) procedure to globally up-scale the highly detailed time-use survey data contained in the American Time Use Survey (ATUS) for 81 US cities which coincide with our internet activity dataset.
By n-fold cross-validation, our method obtains an average error of 11 min. In effect, our approach converts granular internet activity data into a passive chronobiology monitoring platform at global scale. We find that the sleep predictions differ statistical significantly across regions, hinting at an underlying cultural explanation.
This part of our research has also been featured in the MIT Tech Review and Wired:
![]()
![]()
3. Intradiurnal Internet Activity Data Correlates with City-Level Commuting Patters
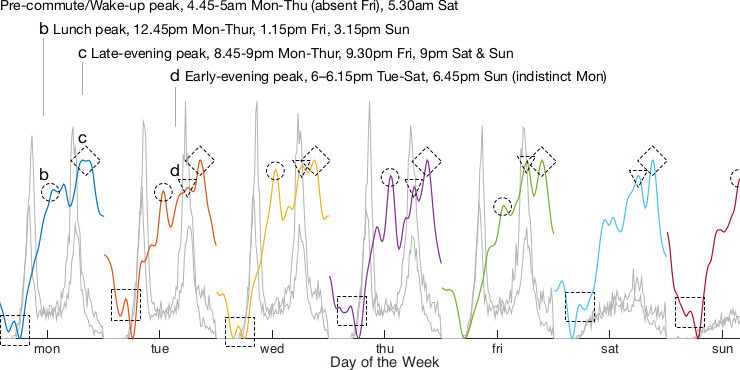
In another validation exercise, we have combined intradiurnal online/offline IP data with Oyster card data from London’s public transport network (see Figure 2). We show that the peaks and troughs in daily IP activity (coloured lines) correlated with daily commuting patterns (grey lines).
Figure 2. IP Activity Correlates with Commuting Behaviour.
4. Inferring Economic Activity from IP Activity Data
We use yearly Gross Domestic Product (GDP) per capita and sectoral productivity (Gross Value Added (GVA) per worker) for 411 large regions in OECD countries and to compare economic activity and internet penetration.
We find a positive correlation between GDP pc and IP pc (Fig. 3(a)).
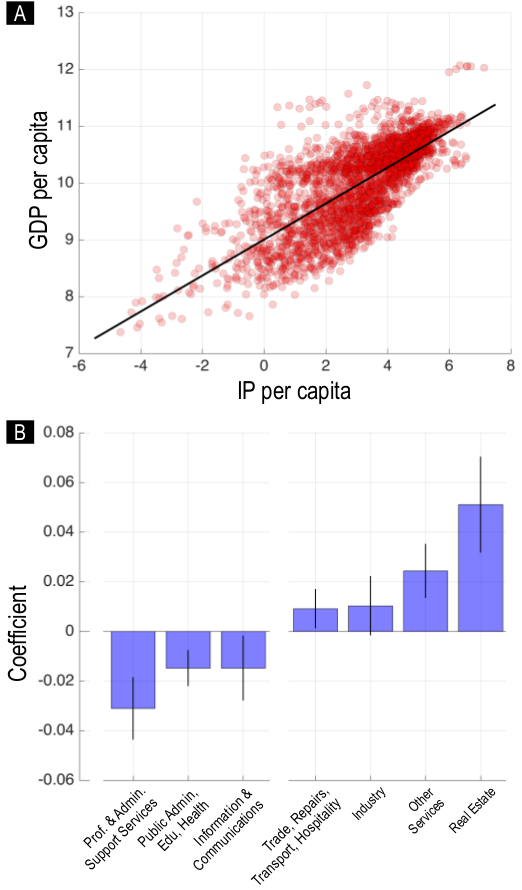
However, as Figure 3 (b) makes clear, increased internet activity is not associated with uniformly positive impacts on all economic sectors within a region. Broadly speaking, we find that service sectors amenable to digital competition through out-sourcing (e.g. publishing, news, film production, administrative support, education) have suffered with increasing local IP concentration, whilst location-constrained sectors have prospered from higher internet concentrations presumably due to lowered consumer search-costs and/or logistic and process efficiency gains (e.g. wholesale, retail, real-estate, repairs, hairdressing, mining, transportation, accommodation).